Marketing Intelligence + AI
AI Analysis & Business Intelligence Agent
Built an automated cross-channel analysis system that collects daily marketing and CRM data, turns it into a management dashboard, and produces weekly AI-assisted diagnosis and recommendations with explicit confidence and data-quality guardrails.
I already had reports. The problem was that they did not talk to each other.
Website traffic, SEO, social, paid media, and CRM each had their own metrics. Looking at one channel at a time could explain what changed inside that channel, but not whether the overall funnel was healthier or where the business problem actually started.
GA4, Search Console, Instagram, Meta Ads, and CRM could all move in different directions. A marketer still had to connect the story manually.
CTR, qualified-lead rate, funnel stages, and other KPIs needed a fixed dictionary so the AI could not silently redefine a metric while reasoning.
Letting an LLM calculate totals, deltas, or conversion rates creates avoidable risk. The system needed deterministic calculations before AI interpretation.
A failed API call should not become zero performance or a reassuring weekly report. The system needed explicit data-quality and confidence rules.
Code calculates the numbers. AI interprets what they may mean.
The system runs three n8n workflows: a Daily Collector, per-article SEO analysis, and a Weekly Insight workflow. Daily metrics are normalized into a shared time series, visualized in a five-page Looker Studio dashboard, and summarized into a weekly management-level diagnosis delivered through Telegram.
Built to turn metrics into a management decision, not another dashboard.
The collector runs automatically every day at 07:00 WIB across GA4, Search Console, Instagram, Meta Ads, and CRM. Sales and CRM data now come from Supabase.
Looker Studio provides Executive Summary, SEO & Content, Ads & Social, Funnel & CRM, and Findings & Recommendations views from the normalized performance history.
Every Monday, the system compares the last 7 days with the 7 days before that, then passes the prepared evidence to the AI for diagnosis and recommendation.
Totals, changes, and business metrics are calculated in code. The AI does not calculate the source numbers; it explains and prioritizes them.
Recommendations use KEEP, WATCH, INVESTIGATE, OPTIMIZE, SCALE, or PAUSE. OPTIMIZE, SCALE, and PAUSE are blocked when confidence is below 0.55.
Each source retries up to three times. Failed data remains blank instead of becoming a false zero, and incomplete weekly data produces a 'belum bisa dianalisis' message rather than a fake normal report.
The system is already collecting production data every day.
The build is complete and daily automation is running. Source numbers have been reconciled with the original platforms and live-run testing has passed. One validation remains: the first weekly AI analysis using 14 days of real production data, expected around 28 September 2026.
Less scattered activity. More operating clarity.
Performance lived across separate platform reports and manual checks.
Daily metrics are normalized into one performance history and management dashboard.
The marketer had to manually connect traffic, content, ads, social, and CRM changes.
Weekly Insight compares periods and creates one prioritized cross-channel management view.
Analysis depended on manual calculations or could tempt the AI to compute numbers itself.
Code owns the calculations. AI receives prepared metrics and focuses on diagnosis and recommendation.
A plausible explanation could easily sound more certain than the evidence.
Evidence is separated into observed, platform-reported, inferred, and correlation-only signals with explicit confidence.
A failed source could create an incomplete report that looked valid.
Retries, blank values, data-quality checks, and a 'cannot analyze yet' state prevent false conclusions.
Insights still needed to be manually summarized after checking dashboards.
Telegram delivers the five highest-priority findings and links directly to the supporting dashboard.
The strongest part is not the dashboard. It is the guardrail around the analysis.
These diagrams summarize the current production architecture and reasoning rules while avoiding raw backend screenshots and private CRM data.
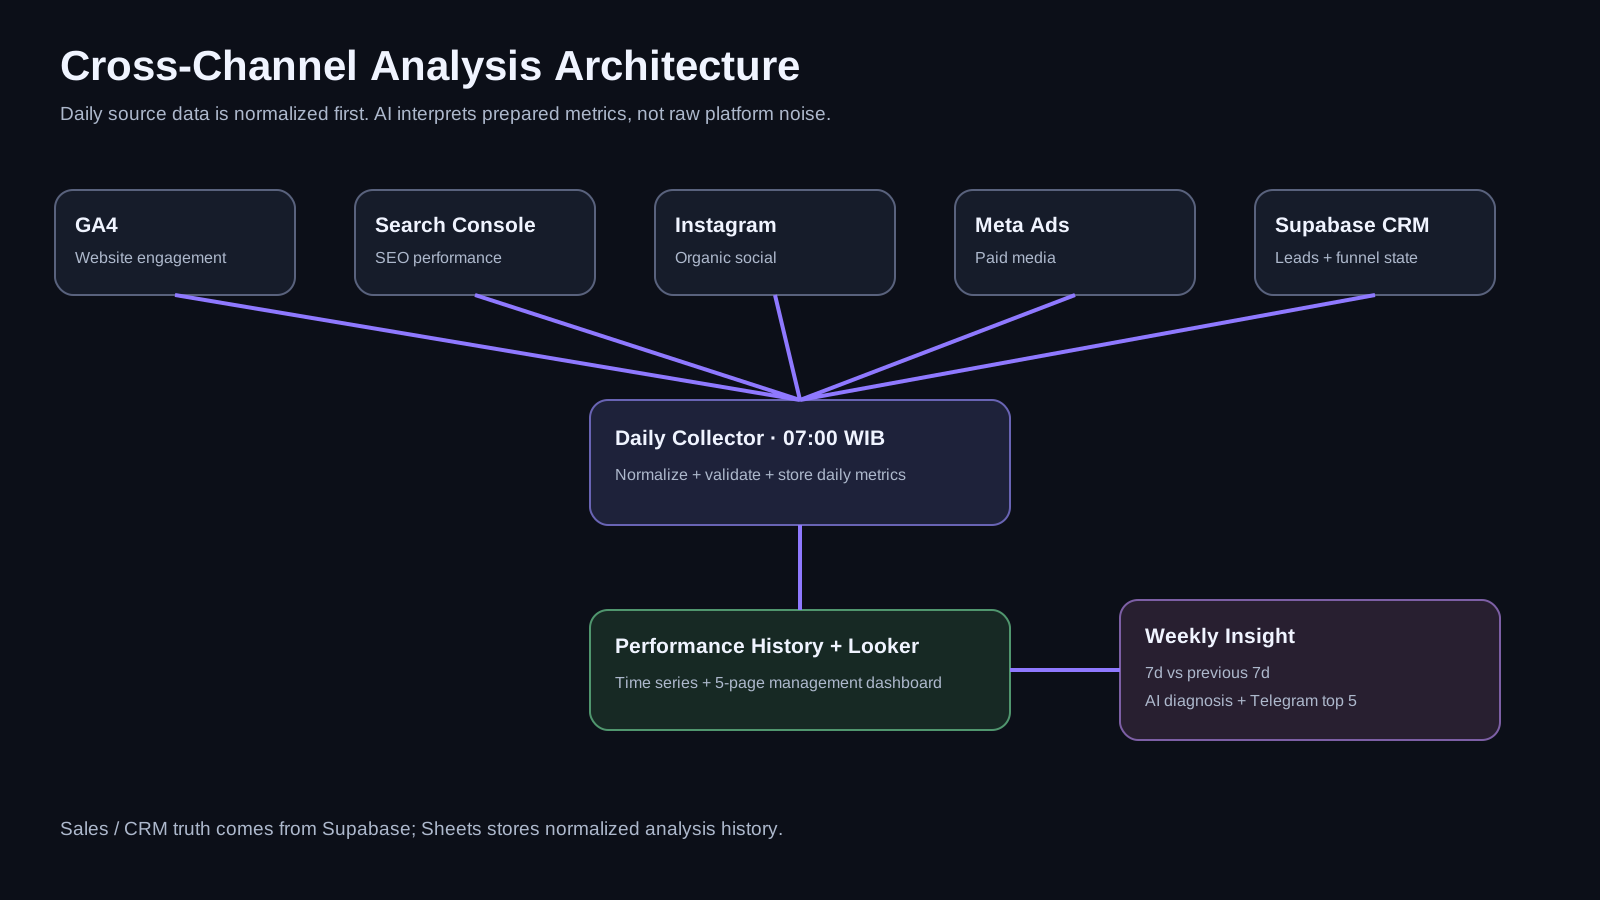
The data layer is deterministic first. AI enters after metrics are normalized and ready for interpretation.
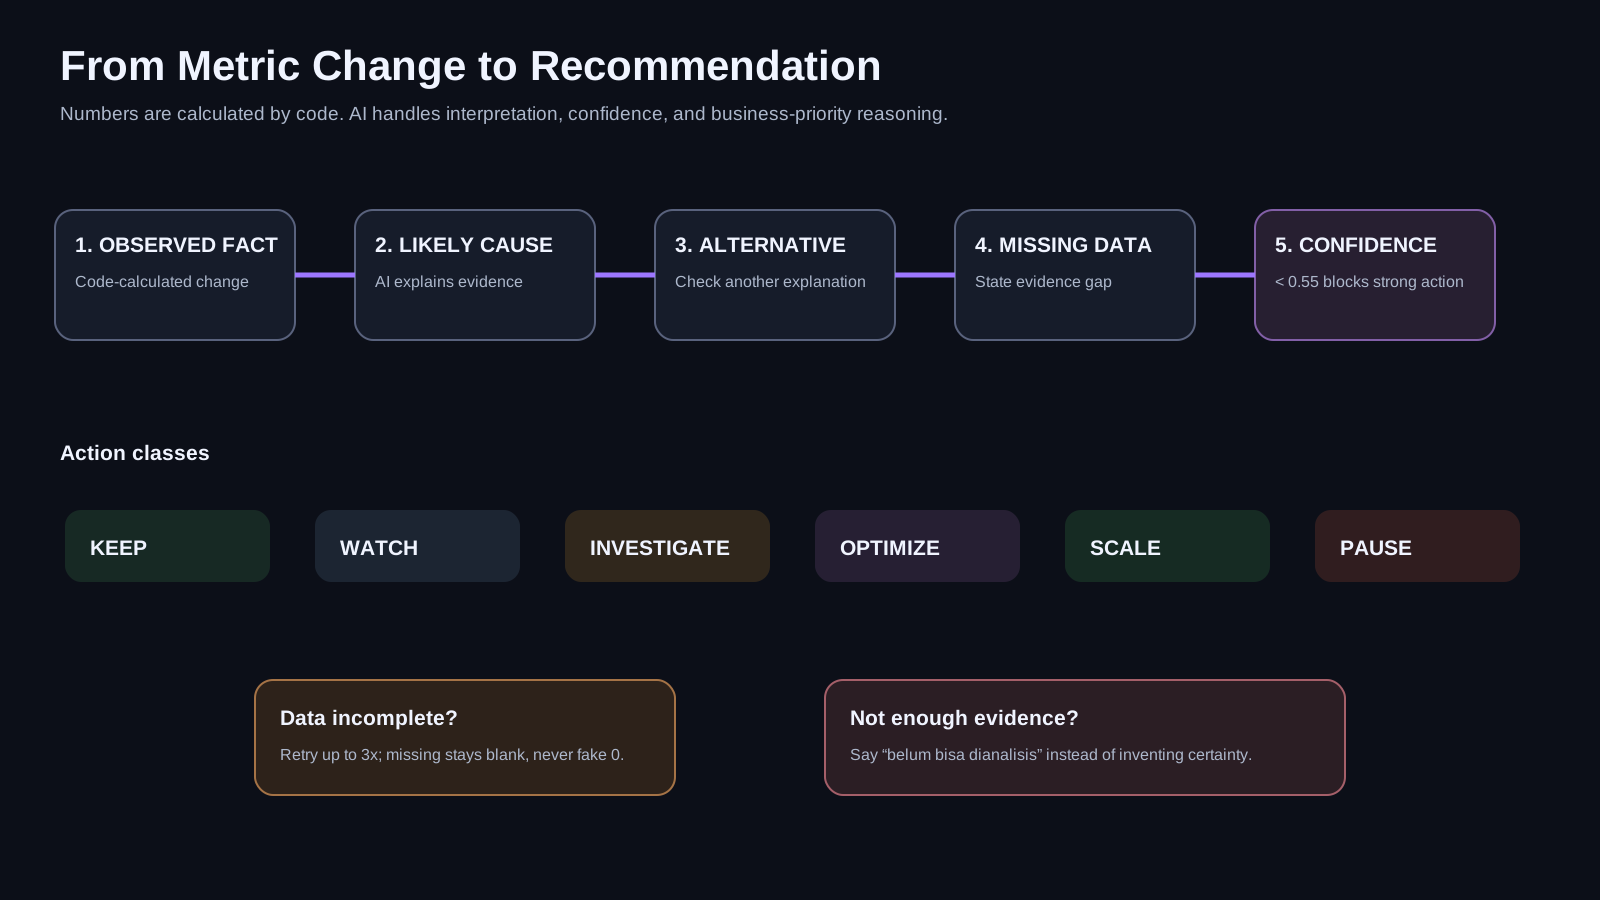
The system separates facts from interpretation and blocks strong optimization actions when evidence confidence is too low.
Build complete, final production validation pending
- Daily Metrics schema is complete. The Performance tab stores one daily row with 24 columns.
- The Data Collector runs automatically every day at 07:00 WIB.
- Search Console data is collected using H-3 because that source is not complete immediately.
- CRM data now comes from Supabase, and the most recent 14 days are recalculated daily because admin entries can arrive late.
- The five-page Looker Studio dashboard is complete.
- Weekly Insight is built and scheduled every Monday, but its first full AI analysis with 14 days of real production data is still waiting for enough history.
- Telegram delivery, daily anomaly alerts, and failure handling are complete.
- Platform numbers have been checked against their original sources and matched. Live-run testing has passed.
Finish validation, then use it as the intelligence layer for the workforce
- Run the first weekly AI analysis against 14 days of real production data around 28 September 2026 and validate it with the final checklist.
- Review recommendation quality, false positives, confidence scoring, and whether the top-five prioritization is useful in real operating conditions.
- Feed validated findings to specialist agents later instead of expanding this agent into an execution engine.
- Use the Analysis Agent as the intelligence layer that informs the future Orchestrator while preserving specialist ownership.
Key takeawayThe goal was not to make AI read more dashboards. It was to give the business one reliable layer that calculates the facts first, explains what changed second, and only recommends action when the evidence is strong enough.
Start a conversation